Laurence was very thorough with every aspect of the project, his communication skills were above and beyond. He was very efficient and met every deadline in advance of what was expected. I would have no hesitation in using his services again.

Approached by a contemporary artist to design and deliver a data visualisation based on a data set that had been collected and analysed in an academic research paper. This was a fascinating project to be involved with in that it combined a number of disciplines including contemporary art, manufacturing, engineering, academic research, data science, and graphic design.

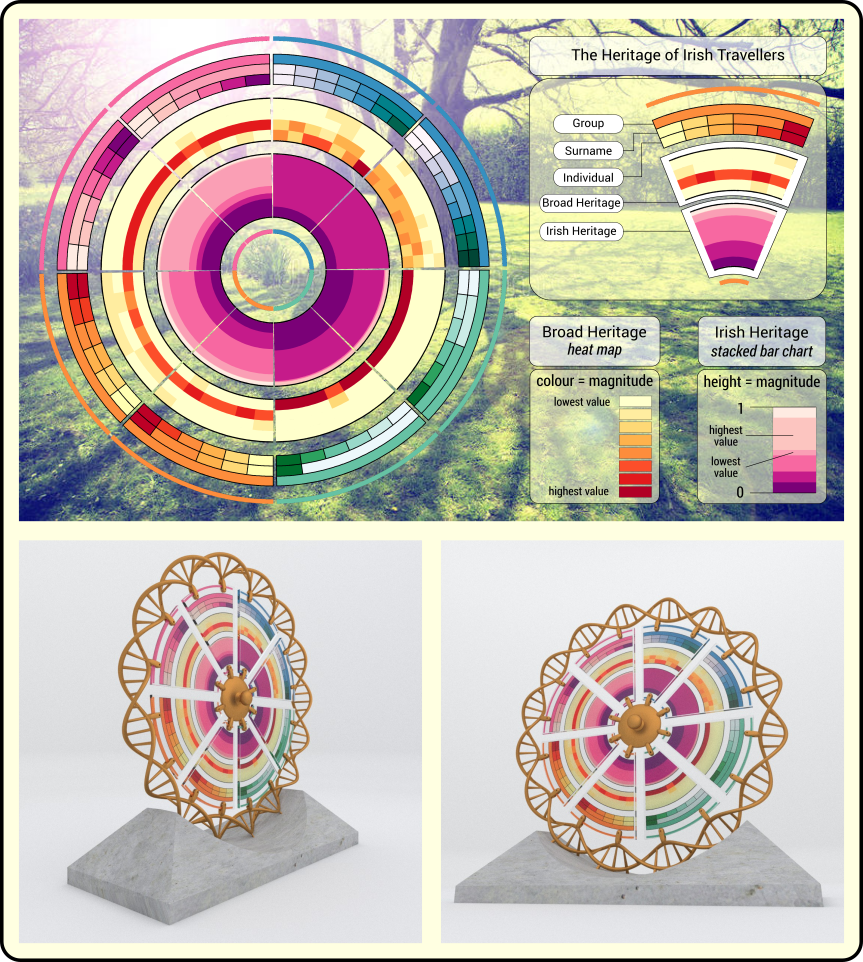
The result, a public sculpture installed in XXX in Ireland, is designed to capture the attention of the general public, inform and encourage discussion and raise awareness of the Irish Traveller community in Ireland and its recent recognition as a minority group.

The Brief

To create an informative data visualisation in the form of a circular graph. The data visualisation will be screen printed in resin and form an integral part of a public sculpture. The visual design must be:

  • appealing, engaging and informative to the general public
  • an accurate representation of the findings of a research study
  • suitable for screen printing in resin
  • dimensionally compatible with an engineering specification
  • divisible into 8 equal sized segments

The History

On 01 March 2017, the Irish government announced formal recognition for Travellers as a distinct ethnic group in Ireland (see this news article).

To mark this historic occasion, Irish mixed media artist Leanne McDonagh decided to create a public art sculpture, and obtained funding from the Irish Government’s Percent for Art scheme to make this a reality.

Leanne had the DNA of a number of Irish Travellers analysed. This formed the basis of an academic research paper written by a team of researchers at the Royal College of Surgeons in Ireland, the findings of which she wanted to represent in visual form as part of the sculpture.

The sculpture would take the form of a wagon wheel (a symbolic piece of imagery among the traveller community), with an outer rim manufactured in bronze in the shape of a double helix, a central bronze hub and 8 coloured wedges screen printed in resin displaying the research data representing the sections of the wheel.

Toolset

Circos

A software package, written in Perl, used for visualising data and information in a circular layout to explore relationships between objects.

Perl

A file and text processing language. Used here for meeting Circos build requirements and for writing scripts to automate the generation of Circos configuration files.

Python

An interpreted programming language. Used here for writing data preparation scripts.

Inkscape

An open-source vector graphics editor. Used here to create the accompanying information display.

GIMP

An open-source raster graphics editor used for image retouching and editing. Used here to cut the circular data visualisation into segments.

Challenges Met

Multi-disciplinary
skill set

This project required a mix of skills:

Hard Skills: requirements analysis; programming; data science; graphic design; familiarity with Circos.

Soft Skills: communication; creativity; an ability to work across a number of disciplines.

Requirements
analysis

Capturing the key design requirements of the data visualisation involved effective communication with an artist, an academic researcher, a design engineer and the resin manufacturer. Each was responsible for signing off an aspect of the design.

Familiarisation
with the tools

The data visualisation was generated using Circos, a highly configurable technical software package that is widely used by the scientific research community. As someone new to Circos I had to learn fast to gain sufficient proficiency to use it effectively.

Mapping
the data

Turning the research data into an infographic that conveys an engaging message about the similarities and differences in genetic heritage between different groups of Irish Travellers required an eye for detail, mathematical rigour, and an ability to interpret data visually.

Working across geographical boundaries

As the project team was spread across two countries, collaboration was remote. Care was taken to mitigate the risk of misunderstandings forming by creating a shared requirements document and sharing drafts of the data visualisations at various stages of development.